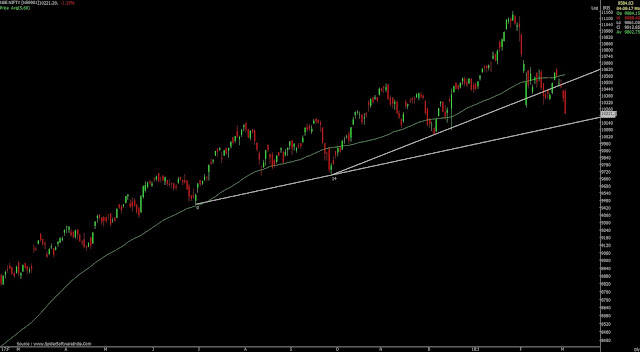
BEAR MARKET :CONFIRMATION AND THE ROLE OF RSI & 10 SMA ON MONTHLY CHARTS

With Nifty & Sensex coming down from highs of Jan 2018 and lot of portfolios having retraced 20-30% from top, there is lot of confusion as to where market is headed. The opinion is split down the middle. Bull camp is treating this is mere correction in on going BULL market and expect to hit new highs in coming months. Bear camp is sure that this is beginning of Long BEAR market and we are getting target from 9000 till all the way down to 6000. We will try to analyse, in this article, How the Beginning of Bear Market looks like and when we get confirmation of Bear market. For the purpose of analysis, we will be looking at SENSEX chart since 1990 on Monthly Time Frame. Also, we will be using Two Technical Analysis Indicators for our analysis :A) RSI - Relative Strength Index (14, S,9) & B) SMA - Simple Moving Average (10) .The Indicators are plotted on monthly chart. First, let's define a Bear Market in Indian Context. As per International Definition...
