BEAR MARKET :CONFIRMATION AND THE ROLE OF RSI & 10 SMA ON MONTHLY CHARTS
With Nifty & Sensex coming down from highs of Jan 2018 and lot of portfolios having retraced 20-30% from top, there is lot of confusion as to where market is headed. The opinion is split down the middle. Bull camp is treating this is mere correction in on going BULL market and expect to hit new highs in coming months. Bear camp is sure that this is beginning of Long BEAR market and we are getting target from 9000 till all the way down to 6000.
We will try to analyse, in this article, How the Beginning of Bear Market looks like and when we get confirmation of Bear market. For the purpose of analysis, we will be looking at SENSEX chart since 1990 on Monthly Time Frame. Also, we will be using Two Technical Analysis Indicators for our analysis :A) RSI - Relative Strength Index (14, S,9) & B) SMA - Simple Moving Average (10) .The Indicators are plotted on monthly chart.
First, let's define a Bear Market in Indian Context. As per International Definition of Bear market, whenever Index drops 20% from Top, we are supposed to be in Bear market. However, historically, Indian markets have been much more volatile. Sensex easily corrects 25 % from top in 2-6 months even in running Bull market and hence, can't be considered as Bear Market. Hence, we will define Bear Market as one when A) Index drops more than 25 % from Top B) The Time taken for correction from Top to Bottom is more than 6 months.
Based on above criterion, so far we have experienced 7 bear markets since 1990 and the details are as below:
| SENSEX BEAR MARKETS | ||||||
| Sr No | Top | Date | Bottom | Date | PriceDrop from Top (%) |
Time (Months) |
| 1 | 4546 | 30-04-1992 | 1980 | 30-04-1993 | 56 | 12 |
| 2 | 4643 | 30-09-1994 | 2713 | 24-12-1996 | 42 | 27 |
| 3 | 4605 | 29-08-1997 | 2742 | 30-11-1998 | 40 | 15 |
| 4 | 6150 | 29-02-2000 | 2595 | 28-09-2001 | 58 | 19 |
| 5 | 21206 | 31-01-2008 | 7697 | 31-10-2008 | 64 | 9 |
| 6 | 21108 | 30-11-2010 | 15135 | 30-12-2011 | 28 | 13 |
| 7 | 30024 | 31-03-2015 | 22494 | 29-02-2016 | 25 | 11 |
Now lets look at the monthly chart for two periods from a) 1990 till 2003 b) 2003 on wards till date and closely analyse the technical conditions.


We can draw following observations from above charts:
1) At the beginning of Bear market , RSI indicator shows reading above 60 in every single condition.
2) Prices closing below 10 SMA is first warning signal of Bear market , though this is not the confirmation.
3) In 6 out of 7 Bear markets (Except 1994), after price closes below 10 SMA, it pulls back above 10 SMA in next 3-4 months.
4) If price does not sustain above 10 SMA after pullback and then takes out Swing low created below 10 SMA, Bear Market is confirmed.
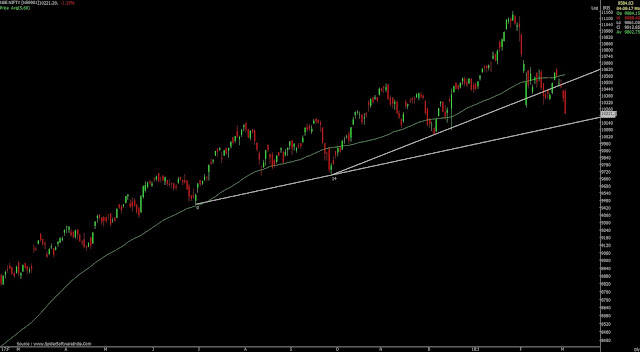
Now, lets look at current scenario:

Currently, RSI reading is above the level of 60 and Price is dangerously flirting with 10 SMA. However, Monthly Close is still above 10 SMA. Bear Market is not confirmed yet based on the price action so far. We will have to patiently wait for another 3-6 months for picture to get clear. We will update you as and when clarity emerges on Bear market conditions. Till then, be ready to manage any eventuality in market and manage risk in your portfolio very cautiously.
Happy Investing.

Great and Awesome Post. Your knowledge is nice. Thanks you for sharing this post.
ReplyDeleteNifty Future Tips
Nice article . These post is informative and good. Nice information about this..more info visit here >> Epic Research
ReplyDeleteVery informative post. Keep sharing more news updates like this. For more such news & nifty market tips by Ripples Advisory, visit - Nifty Future Tips
ReplyDeleteThis blog is very useful for trders. here are i find monthly technical analysis report. you can easily understand what is market condition.Good job ! Keep sharing this type of information.Epic Research
ReplyDeleteThank you sharing valuable thing,it is very useful to everyone and they provide a lot of thing do to improve the students capability.
ReplyDeletestock market courses in delhi
Stock Market Institute in Delhi
Share Market Training in Mumbai
Share Market Courses in Mumbai
Share Market Classes in Chennai
This article really helpful and explained very well.So i am really thankful to you for sharing keep it up.
ReplyDeleteDemat account broker
Traders that wish to remain organized and enhance their performance would benefit greatly from using the WealthBee trading journal excel. You can easily monitor your trades, evaluate your methods, and spot trends to boost your profits thanks to its intuitive design. In addition, it may be adjusted to suit your trading preferences because it is adjustable. I would suggest it to anyone who is serious about trading.
ReplyDeleteThank you for sharing this article. I found it very useful and will certainly share it with others.
ReplyDeleteStock Market Investments